Graphical representation

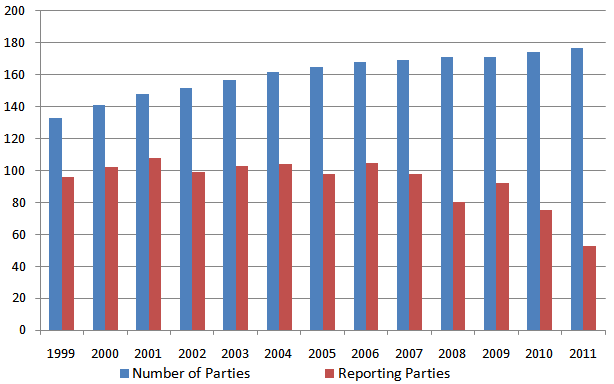
The table and its graphical representation below (as of 30/04/2015) show the ratio between the number of Parties to the Basel Convention and the number of Parties which transmitted their national reports*:

Parties Years 1999 2000 2001 2002 2003 2004 2005 2006 2007 2008 2009 2010 2011  2012 2013 
Number of Parties 133 141 148 152 157 162 165 168  169  171  171  174  177 178  180 
Reporting Parties 96 102 108 99 103 104 98 105 100  82  94  88  87  84 68 

 (*) The European Union is not considered in these numbers.
The table below shows (as of 04/03/2013) the ratio between the number of Parties to the Basel Convention in each of the UN geographical region and the number of Parties which transmitted their national reports within each of these regions*

Region Concept 1999 2000 2001 2002 2003 2004 2005 2006 2007 2008 2009 2010  2011
Africa Number of Parties 28 32 34 35 37 41 44 46  47  48 48   49  49
  Reporting Parties 16 17 18 17 17 15 18 21  13  8  13 8  4
Asia and Pacific Number of Parties 33 34 37 40 42 43 43 43 43  44  44  46   48
  Reporting Parties 26 22 23 20 23 24 19 20  19  17  19  19  13
Central and Eastern Europe Number of Parties 19 20 21 21 21 21 21 22  22 22  22  22   22
  Reporting Parties 15 19 19 21 20 20 18 19  21  17  19  16  12
Latin America and Caribbean Number of Parties 27 28 29 29 30 30 30 30  30 30   30 30   31
  Reporting Parties 14 18 21 15 17 19 17 21  20  15 16   11  9
Western Europe and Others Number of Parties 26 27 27 27 27 27 27 27 27  27  27   27  27
  Reporting Parties 25 26 27 26 26 26 26 24  25  23  25 21   15

 (*) The European Union is not considered in these numbers.